Why particulate matter?
Since we are facing many challenges regarding air pollution in big cities it’s important to actually show everyone what’s going on. Using data to communicate the problems is an important step to initiate next steps to eventually make our all lives a little healthier. In Germany the Umweltbundesamt provides a data platform where one can download all the data from the static monitoring stations in Germany. In 2016 there are almost 350 stations measuring PM10, PM2,5 and the NO2 pollution. Another great project comes from Stuttgart. luftdaten.info not only provides data, collected by citizen and visualized on a map. They also are providing a toolkit for building your own PM sensor.

Our goal
It’s great seeing all the efforts towards making health related issues more transparent. Visualizing the data can help to communicate the problems to citizens and politicians. Both sure have interests in recognizing the challenges to take the next steps and eventually do countermeasures.
With Sense10 we are taking the particulate matter sensing to the next level by enabling people carrying the sensors with them. We want you to attach the Airrohr on your bicycle or stroller or backpack. We want you to measure particulate matter where you go. We think this is an important information we need to communicate. We want to answer the question:
How is the individual citizen affected by air pollution on a daily basis?
Some backround
In its factsheet from 2016 the World Health Organisation is providing some interesting key facts:
“Air pollution is a major environmental risk to health. By reducing air pollution levels, countries can reduce the burden of disease from stroke, heart disease, lung cancer, and both chronic and acute respiratory diseases, including asthma.”
“The lower the levels of air pollution, the better the cardiovascular and respiratory health of the population will be, both long- and short-term.”
“In 2014, 92% of the world population was living in places where the WHO air quality guidelines levels were not met.”
“Ambient (outdoor air pollution) in both cities and rural areas was estimated to cause 3 million premature deaths worldwide in 2012.”
This paper from the European Commission states that
“Reducing global particulate matter pollution could save millions of lives.”

The team, consisting of Hannes, Joscha, Til, Jannis and me, has been incredible productive throughout the whole Cyclehack.
Team work!
Within the two days of the Cyclehack Berlin we developed a functional prototype which measures the air quality while being mobile on a bike. The idea was to combine the Airrohr from the Luftdaten.info initiative with the LoRaWAN technology. We now sending the exact location of the LoRa Node in combination with the measurement data from the NovaPM10 sensor. This then gets visualized on a map to enable people to watch where a bicyclist gets into trouble in terms of air quality.
When eating an elephant take one bite at a time
We figured it would be helpful to segment the whole project into smaller steps so that everyone involved can easily choose what he would like to work on. Friday was pitch day. The idea was already clear to me. I just had to present it in a understandable manner so I could inspire as many people as possible. The team formed quickly and we were ready to start. First I quickly explained what LoRa is and does and then segmented the whole work into smaller steps. First step was to get sensor data from the NovaPM10 Sensor. Since this was originally build to transmit data via WiFi we had no use for the pre-installed program on the board.
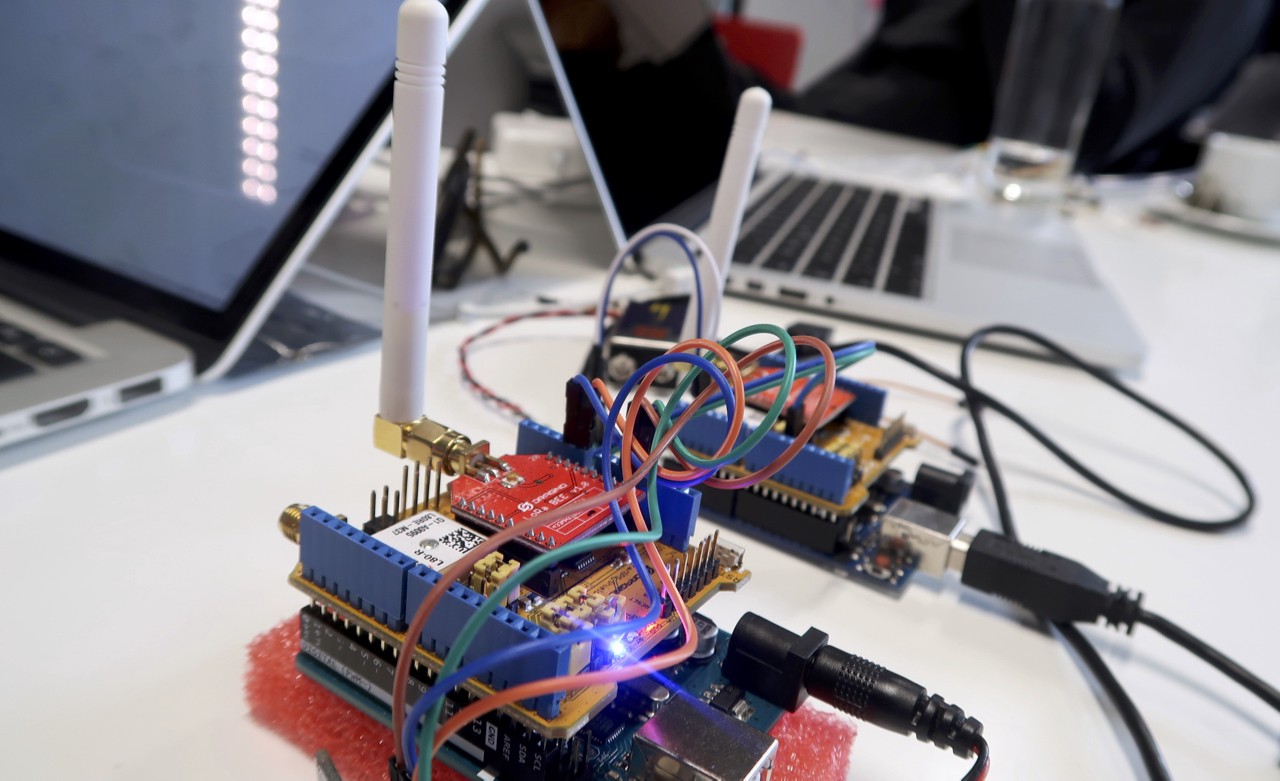
We then used the GPS module to track the location of the nodes. A blinking blue light indicates that the node has a steady connection to at least three GPS satellites.
Third step was combining the PM10 sensory data and the GPS location data and transmitting the whole package via the LoRa protocol to the TTN. We were very fortunate to actually get a connection from the FabLab to the Central Station LoRa Gateway, which is operated by the DB Systel. (Thanks for that!) With Mapbox we then made the whole data visible to everyone. The map we developed shows location and air quality data live from the box’ current location. The time slider on the bottom gives access to some recent history data.
Since the whole technical setup is kind of fragile and definitely would be outside most of the time, we quickly created a box and laser cutted it. This is not only helpful for protection from wind and weather it also looks cool. We also engraved our logo on the transparent roof. (Which I quickly made on the train ride)

The Code for the arduino setup and the web backend is open source and available at Github and Github.